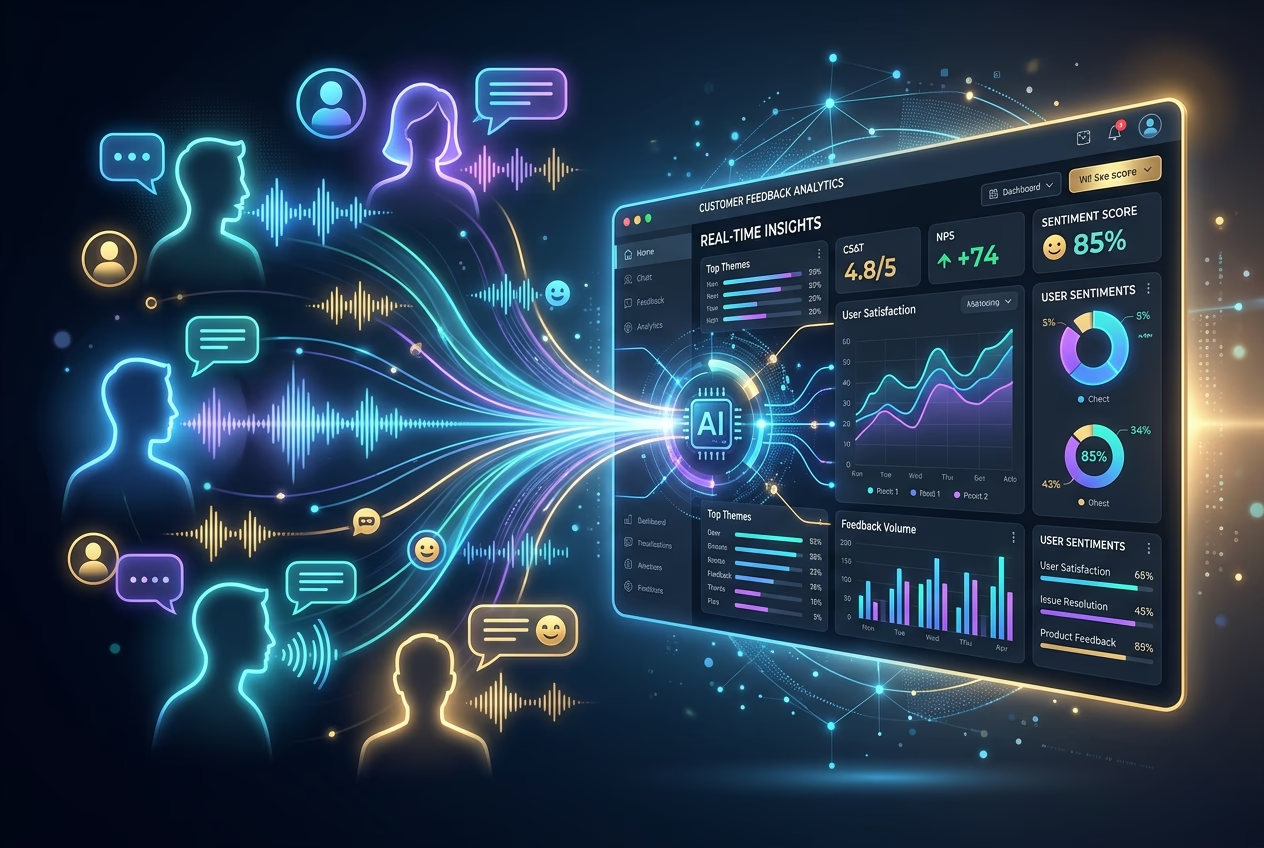
Enterprise Voice of the Customer
Transforming Customer Insights
Empowering Data-Driven Customer Experience as a Senior UX/UI Designer on the Enterprise Voice of the Customer (EVOC) project at Highmark, my objective was to create an intuitive, powerful platform that synthesizes vast amounts of unstructured customer feedback into actionable insights. This project details my approach to designing a system that not only replaced an expensive third-party vendor but significantly enhanced Highmark's ability to understand, visualize, and act upon the true "voice" of its members and patients.
EVOC is an in-house analytical tool that aggregates qualitative feedback from diverse channels (call transcripts, NPS surveys, social media, etc.), processes it through advanced Natural Language Processing (NLP) models, and presents it via interactive dashboards. The goal was to empower Highmark's CX team and product management groups to make data-informed decisions that improve customer satisfaction, streamline journeys, and achieve business objectives.
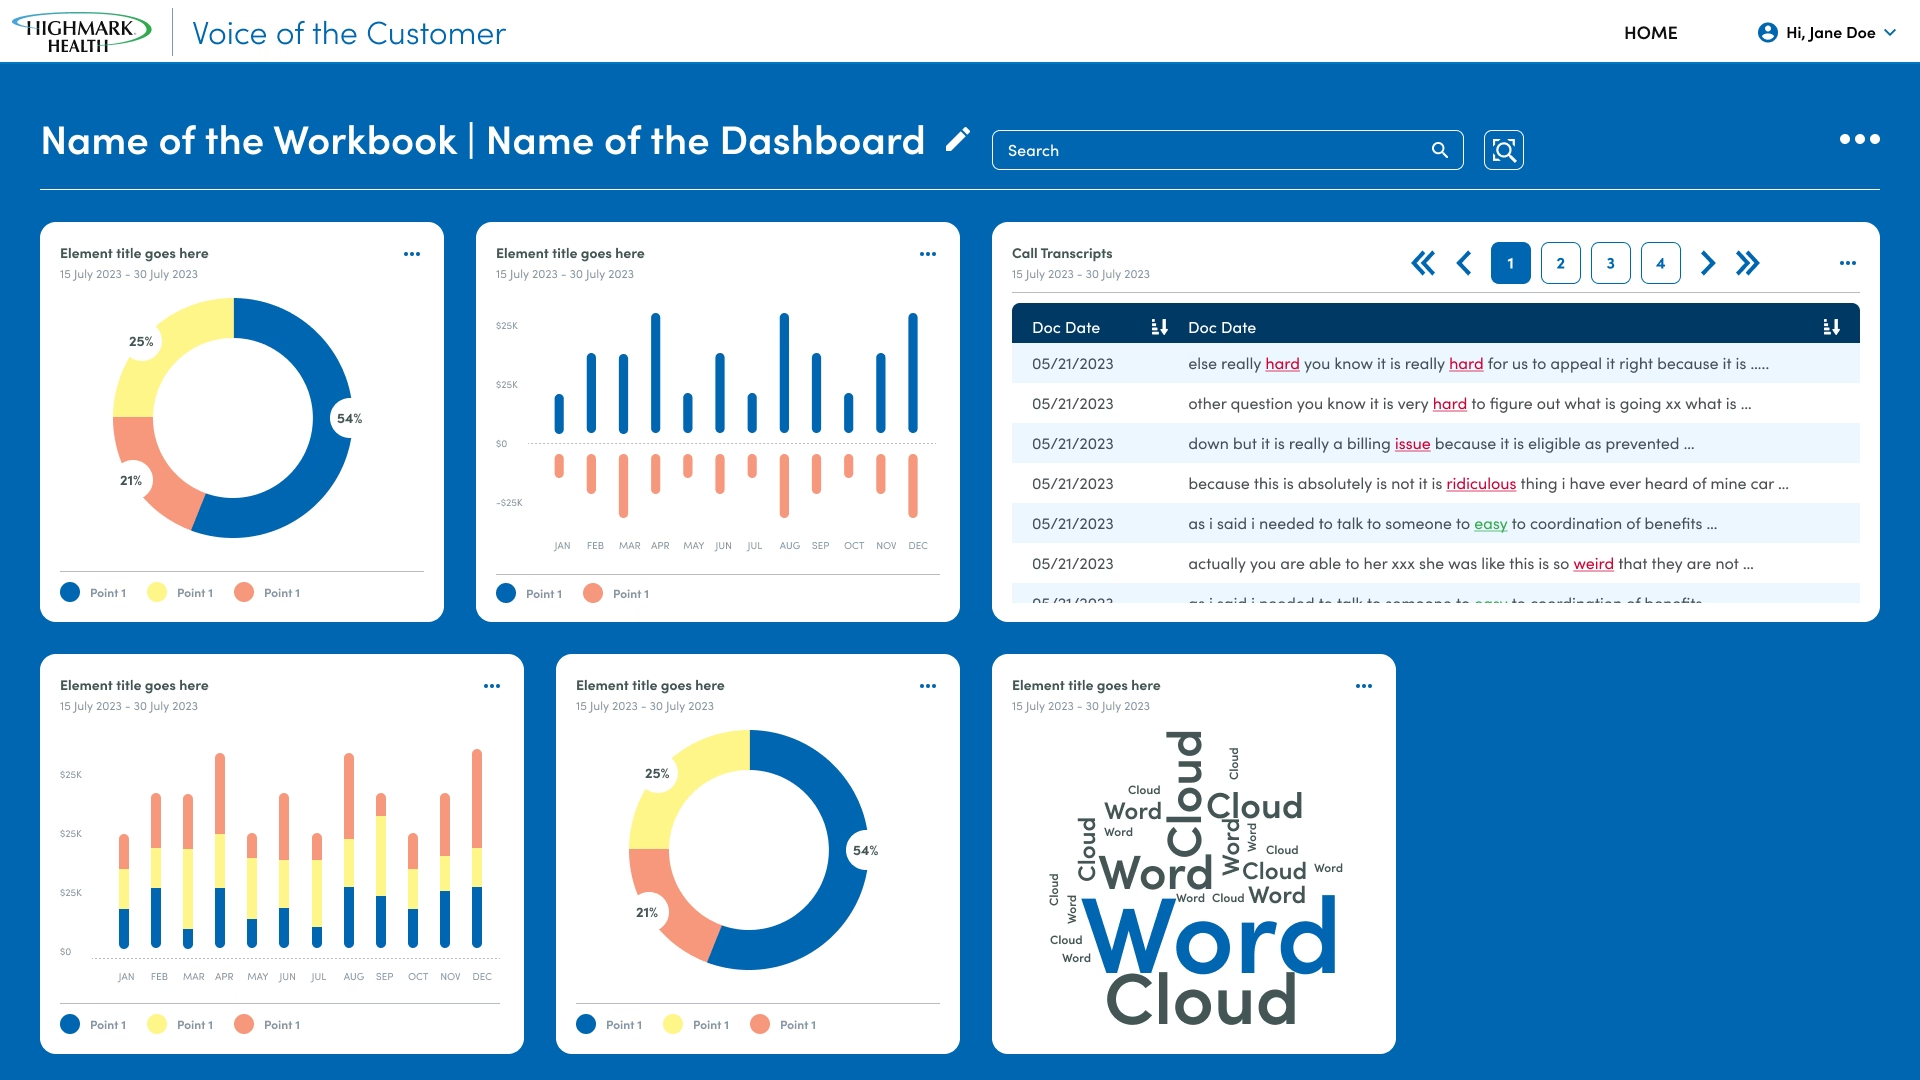
Dashboard Screen
The Challenge
Bridging the Gap Between Data and Empathy Highmark faced a critical need to deepen its understanding of customer experiences. The existing solution, an expensive third-party vendor, presented several significant challenges
Data Governance & Incomplete Insights
Strict data governance policies prevented the sharing of sensitive information, such as full call center transcripts. This resulted in heavily redacted data, rendering critical feedback "a lot less meaningful" and providing an incomplete picture of customer sentiment.
Data Silos & Holistic View Gaps
Feedback was scattered across various channels, making it difficult for the CX team to obtain a unified, holistic view of the member/patient journey. Understanding pain points across touchpoints required manual effort and disconnected analysis.
Actionable Insights Deficiency
While data existed, transforming raw feedback into easily digestible, actionable insights for prioritization and business decision-making was a bottleneck.
Summary of Challenge
My core design challenge was to overcome these limitations by developing an internal platform that could handle sensitive data, offer unparalleled flexibility, and most importantly transform complex, unstructured text into clear, empathetic, and actionable intelligence.
Iterative & Deeply Collaborative Design Process
How I Approched It ?
My approach was iterative and deeply collaborative, focusing on understanding the nuanced needs of various stakeholders, from CX analysts to product managers.
User Research
Engaged directly with the Customer Experience (CX) team (the primary client and dashboard creators), as well as beta testers (dashboard consumers) from the Product & Health Experience Department.
Key Questions Explored
• What are your daily tasks related to customer feedback?
• What decisions do you need to make based on this feedback?
• What information is missing from the current tool
• How do you currently measure customer sentiment or journey effectiveness?
• What "moments that matter" do you prioritize?
Workflow Analysis
• Mapped out existing workflows for gathering and analyzing customer feedback to identify pain points and opportunities for efficiency gains through visualization and interaction design.
Feedback Integration
• Collaborated closely with NLP experts to understand the capabilities and outputs of their sentiment, emotion, and member journey models. This ensured the UI could effectively interpret and display these complex analytical results.
Information Design
A critical aspect was to establish a clear hierarchy for vast amounts of feedback data and NLP outputs.
Layered Detail Model
• Designed an information architecture that allowed users to progressively drill down from high-level trends (e.g., overall sentiment) to granular details (e.g., specific quotes, emotional intensity, member demographics).
High-Level Overview
• Dashboards provide aggregate views by source, sentiment, topic, and emotional categories.
Mid-Level Interaction
• Interactive charts and filters enable users to isolate specific segments (e.g., ACA members, enrollment topics) or compare data over time (quarter-by-quarter trends).
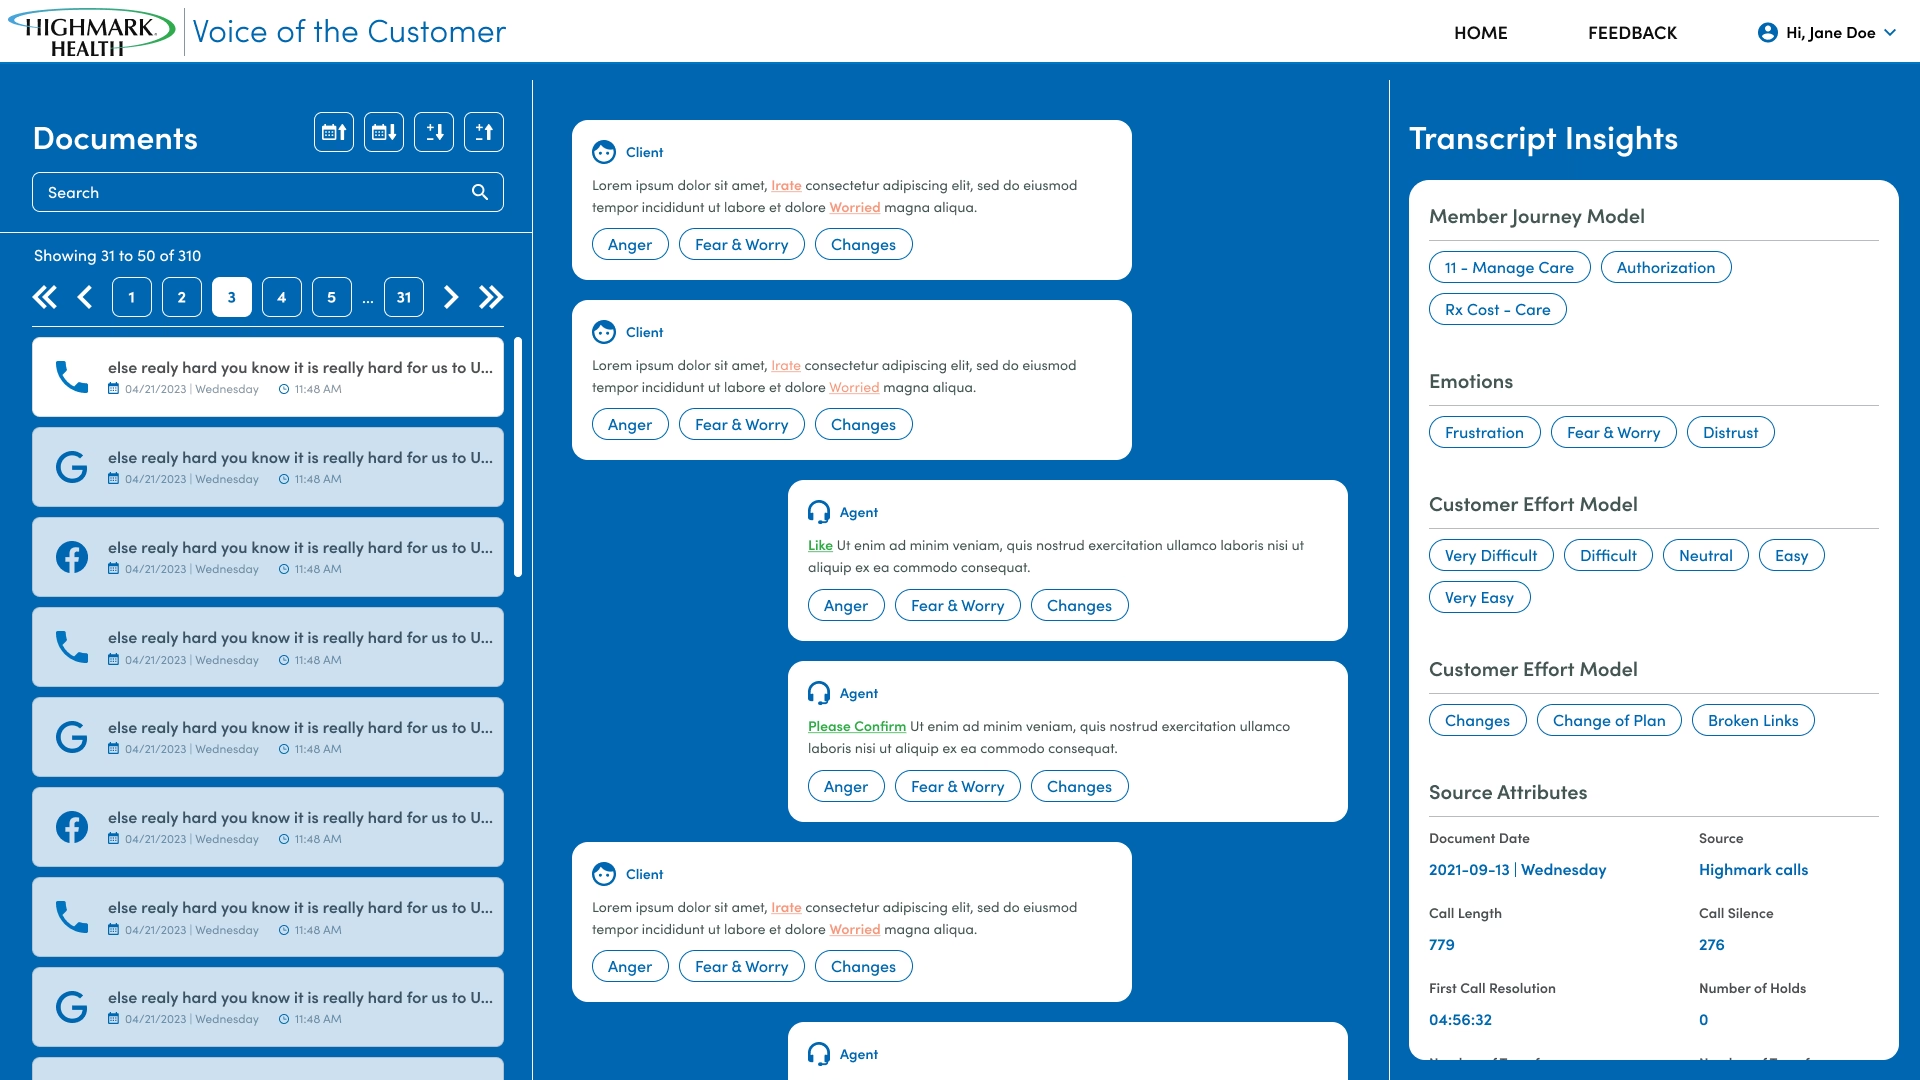
Deep Dive on Document Explorer
• The Document Explorer provides access to the actual raw feedback, highlighting positive/negative keywords, associated topics, emotions, and relevant source attributes (member demographics, NPS scores).
Interface Design
Design philosophy for EVOC centered on clarity, efficiency, and actionable insight.
Intuitive Dashboard Experience for Consumers
• Primary Goal was to make complex data accessible and understandable to non-technical users.
• Designed a clean, modern interface with a focus on visual hierarchy to draw attention to key metrics and trends. Common chart types (bar graphs, pie charts, tables) were used for familiarity.
• Implemented dynamic filters allowing users to quickly narrow down data by various attributes (source, topic, sentiment, emotion, date range) with immediate visual feedback on the dashboards.
• Enabled seamless transitions between aggregated views and detailed feedback, supporting both strategic overviews and deep investigational analysis.
• Ensured that clicking on a data point in a chart (e.g., "Experience Care" in a pie chart) would filter all other relevant elements on the dashboard, allowing users to effortlessly explore interconnected insights.
Powerful Creation Workflow for Power Users
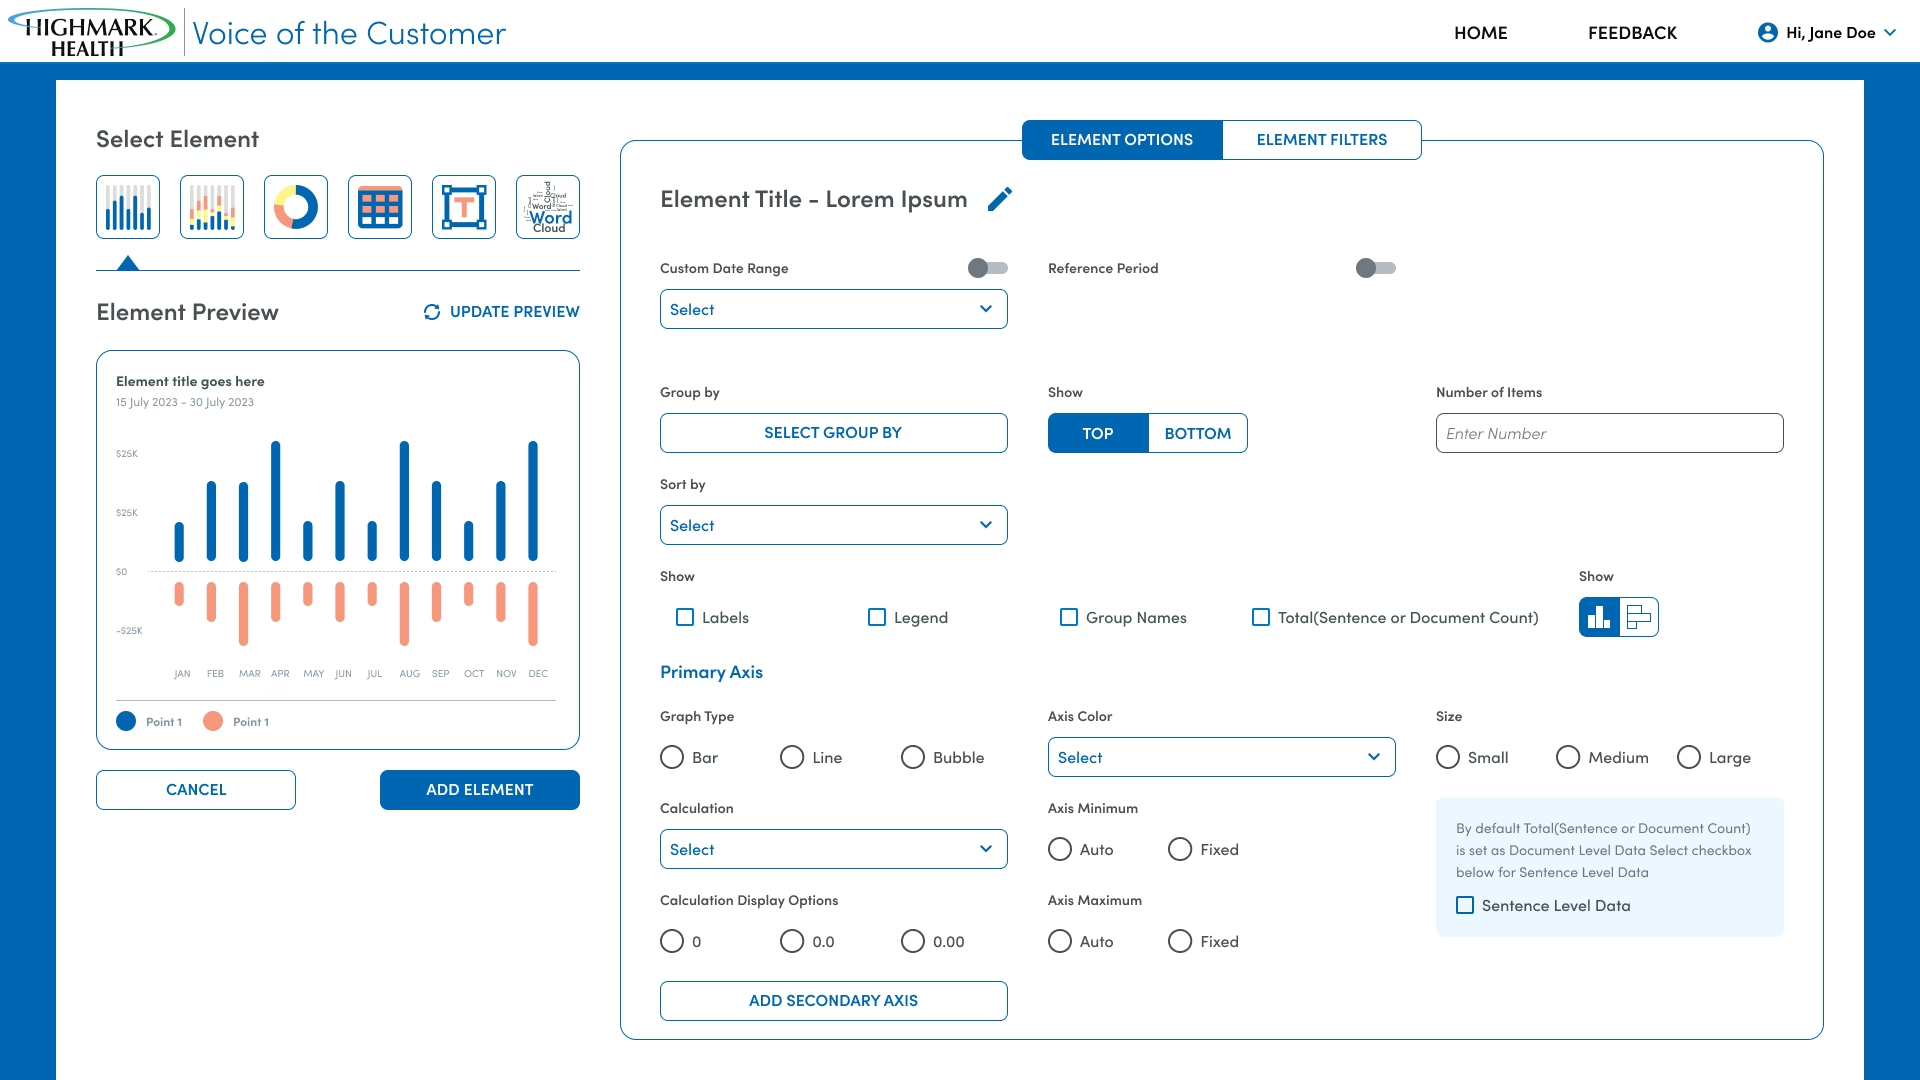
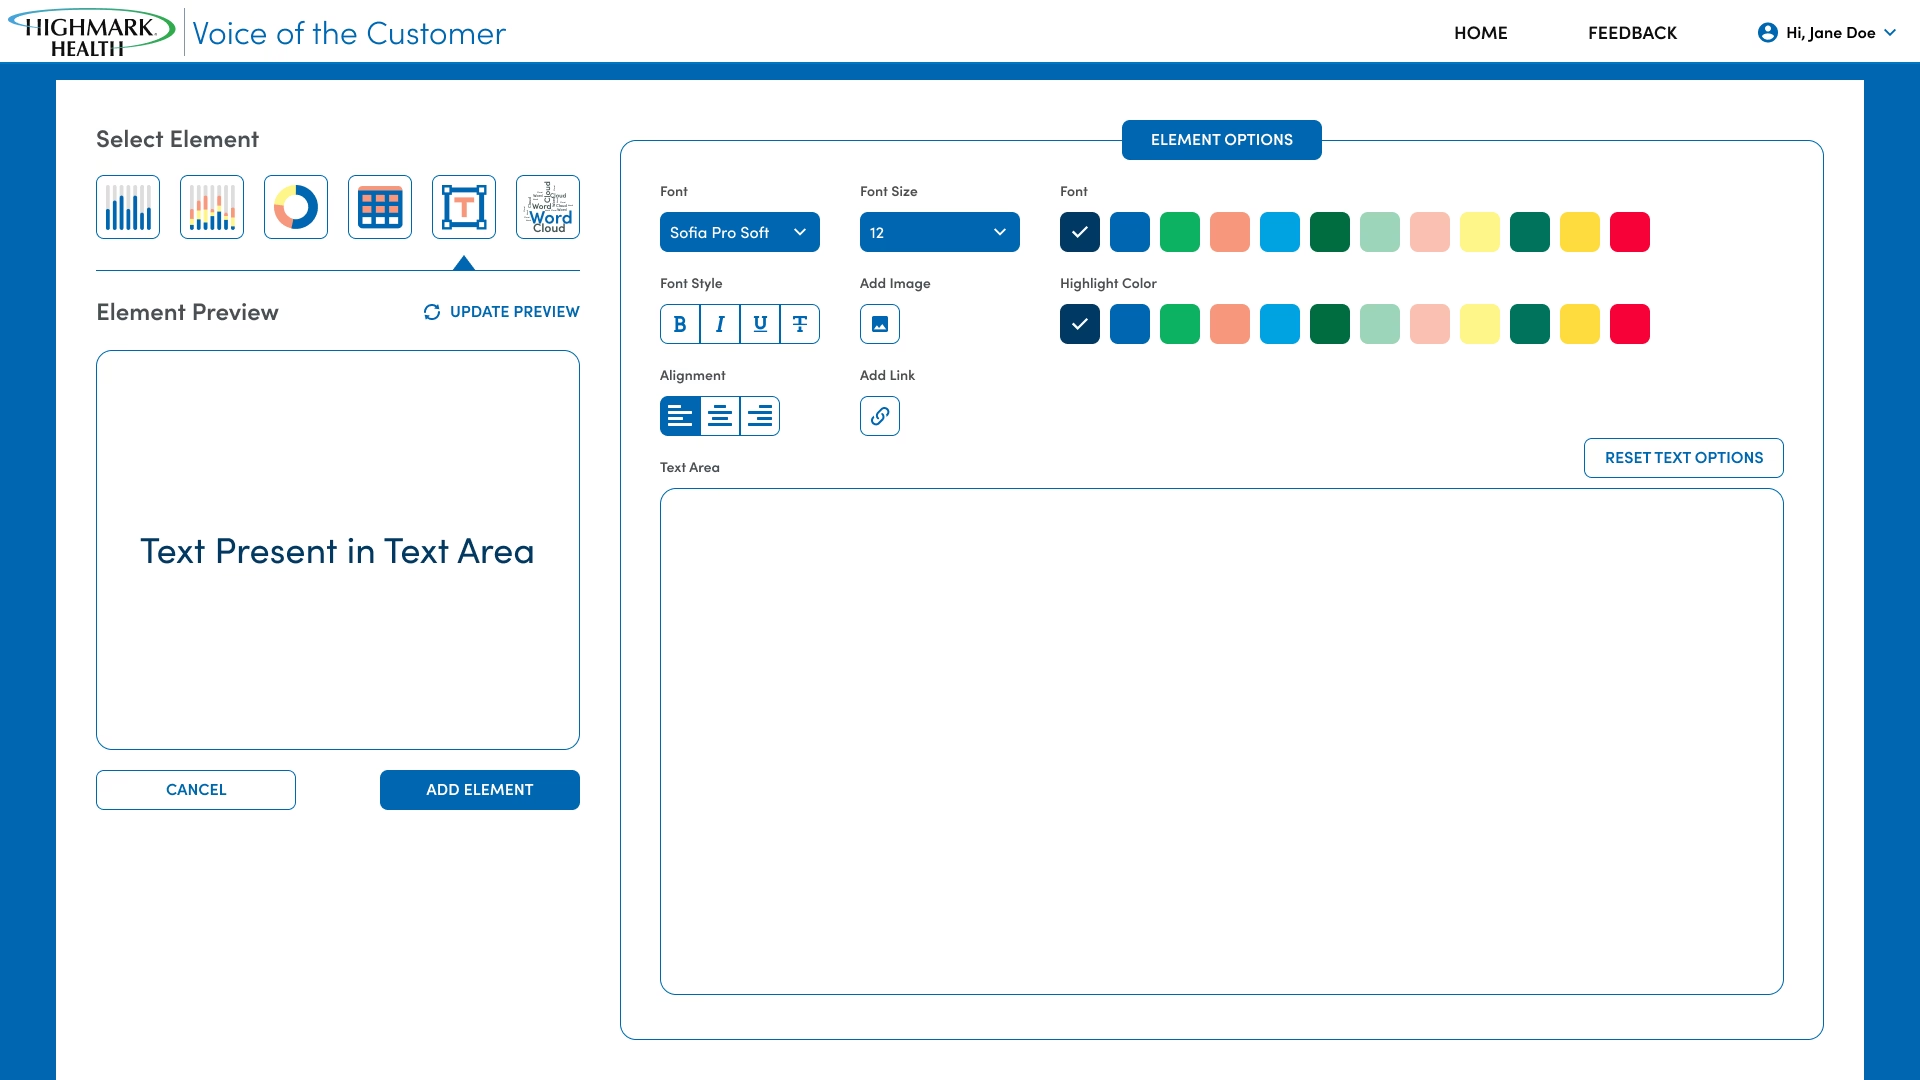
• Primary goal was to empower CX team members to build highly customized, purpose-driven dashboards without requiring technical development.
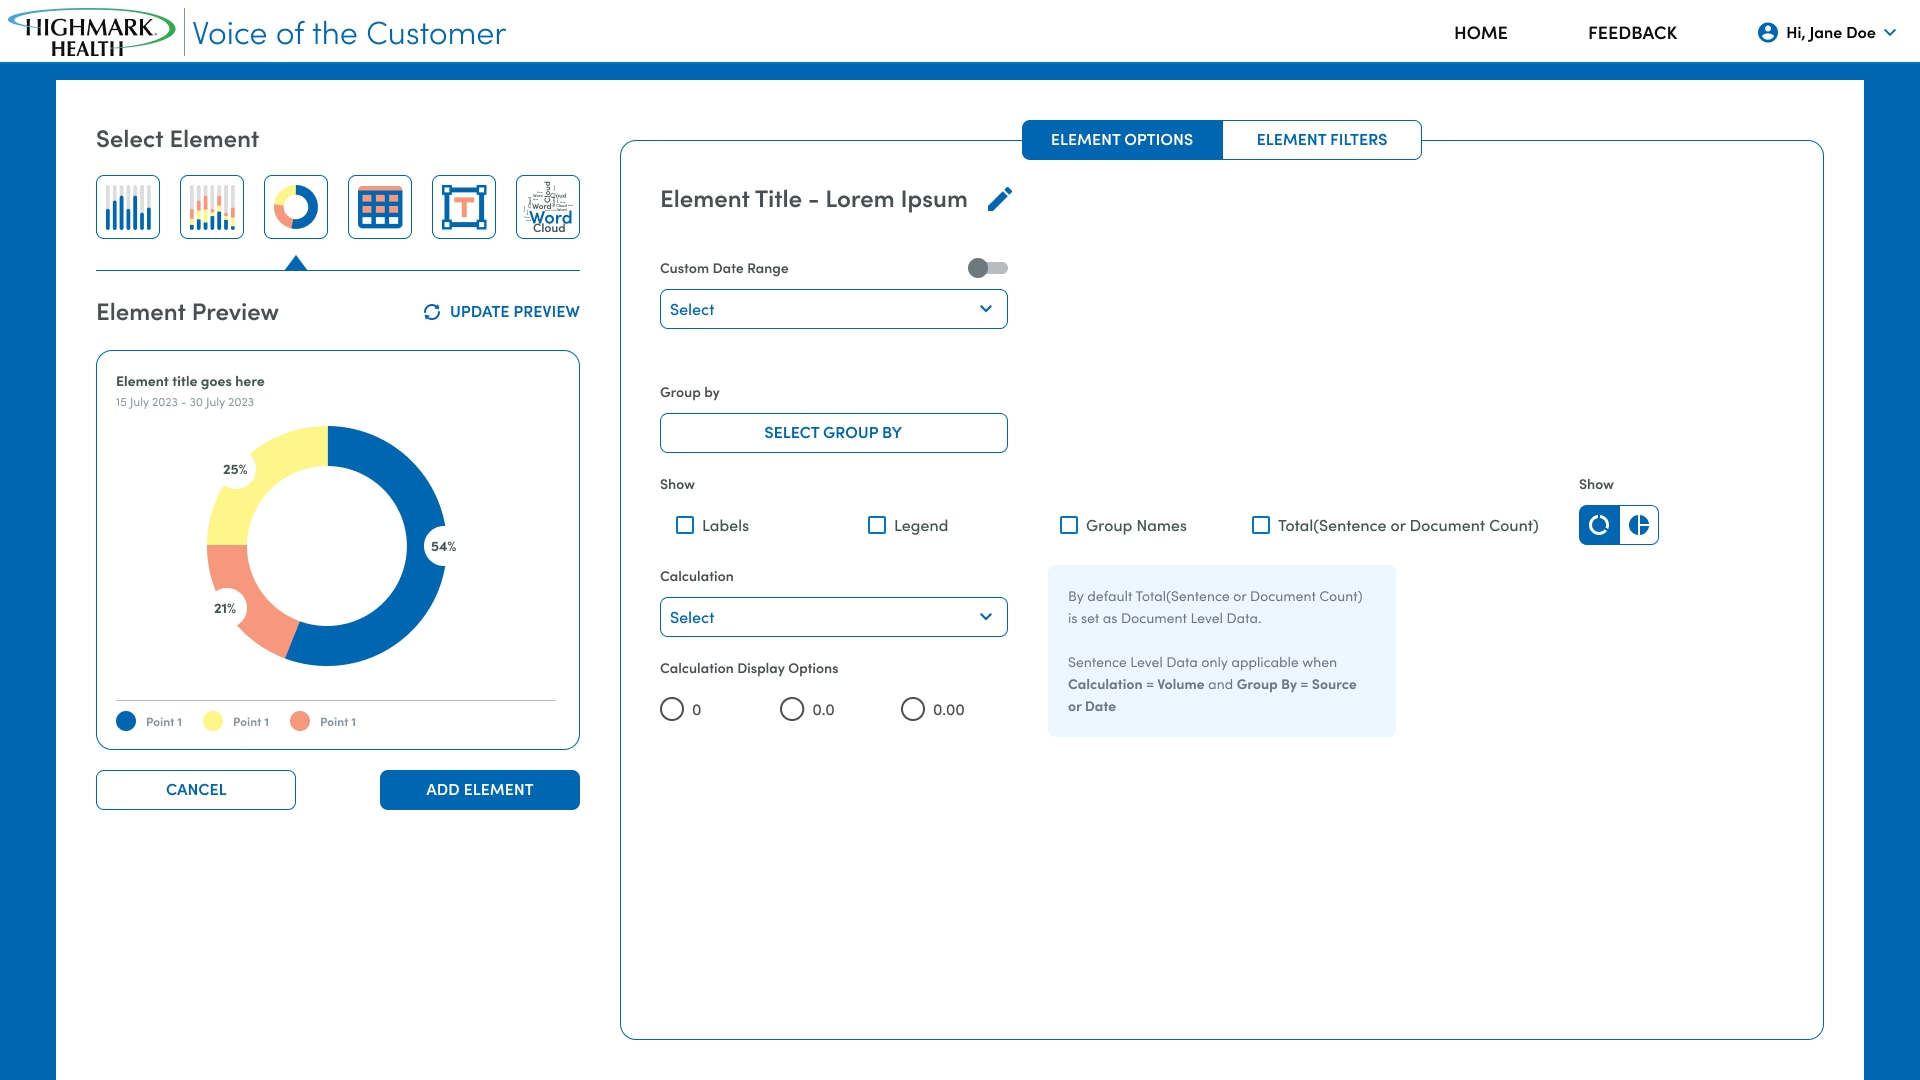
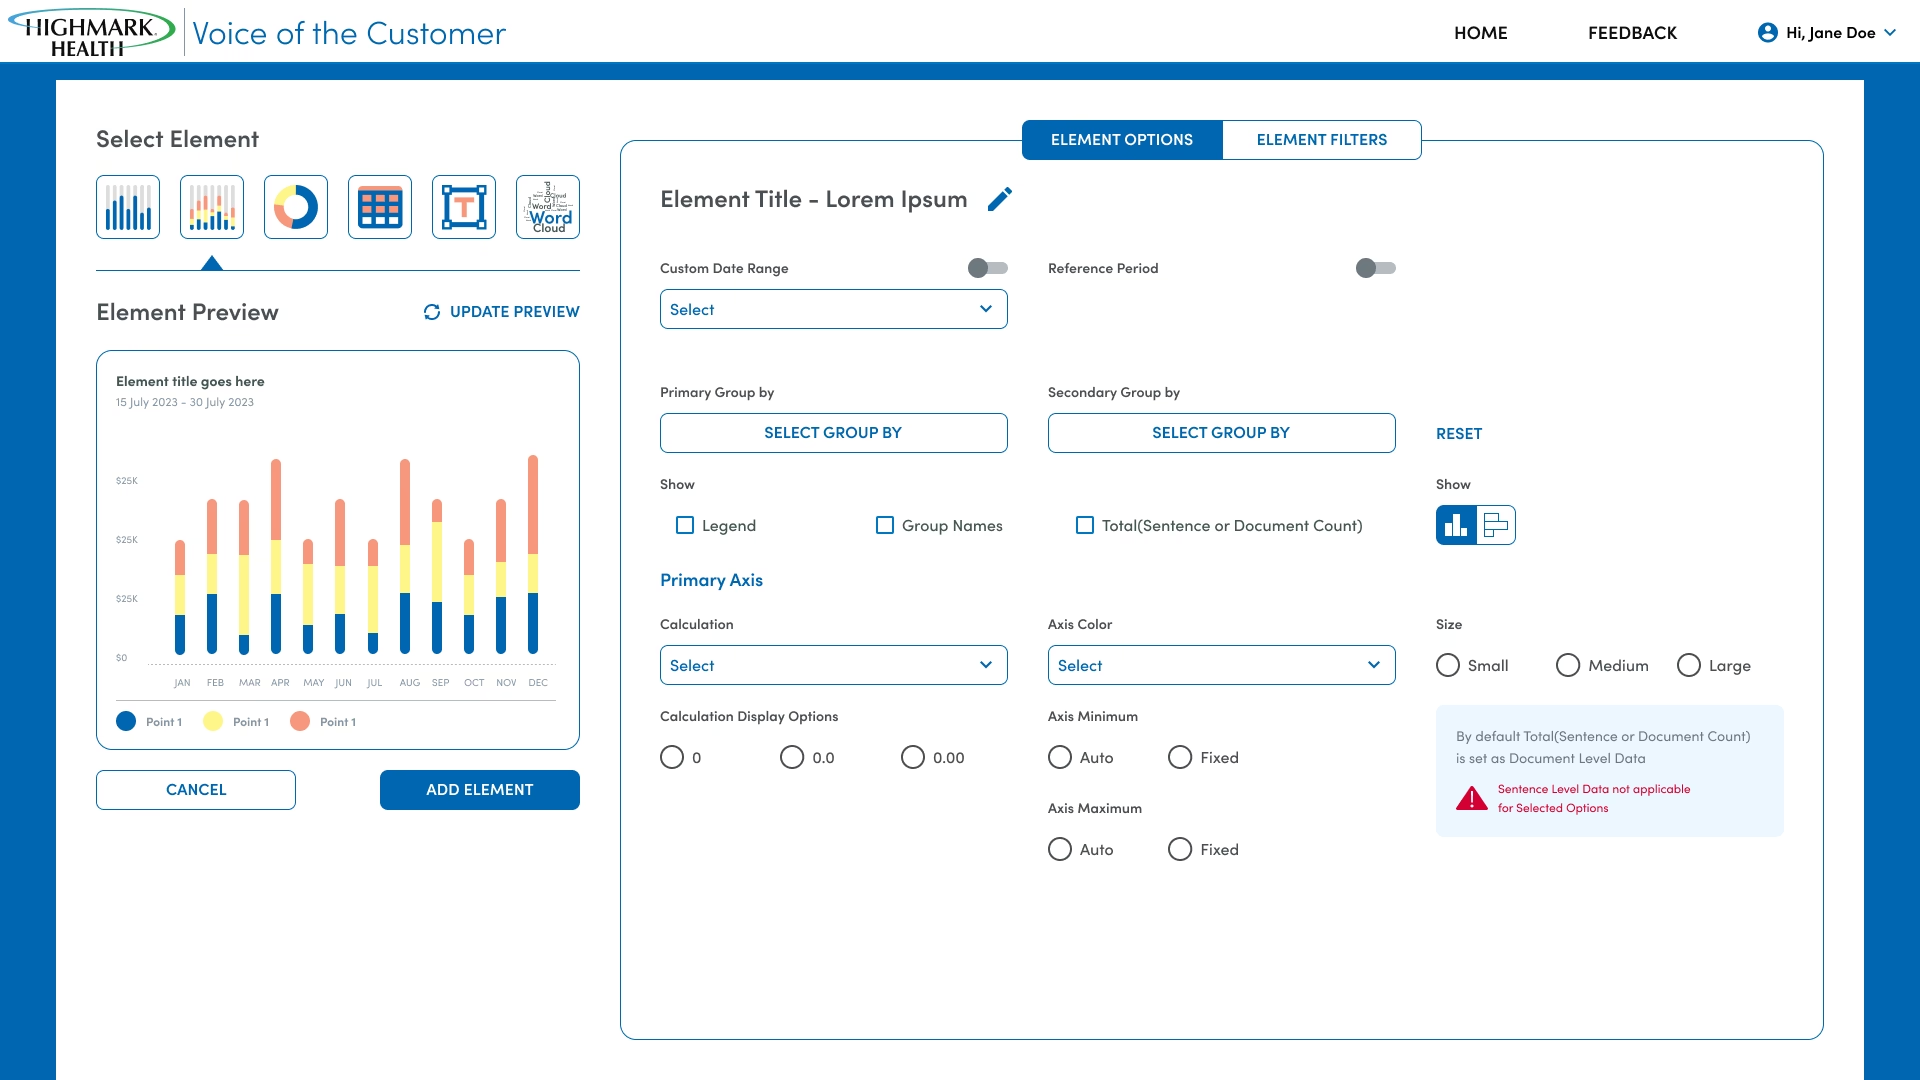
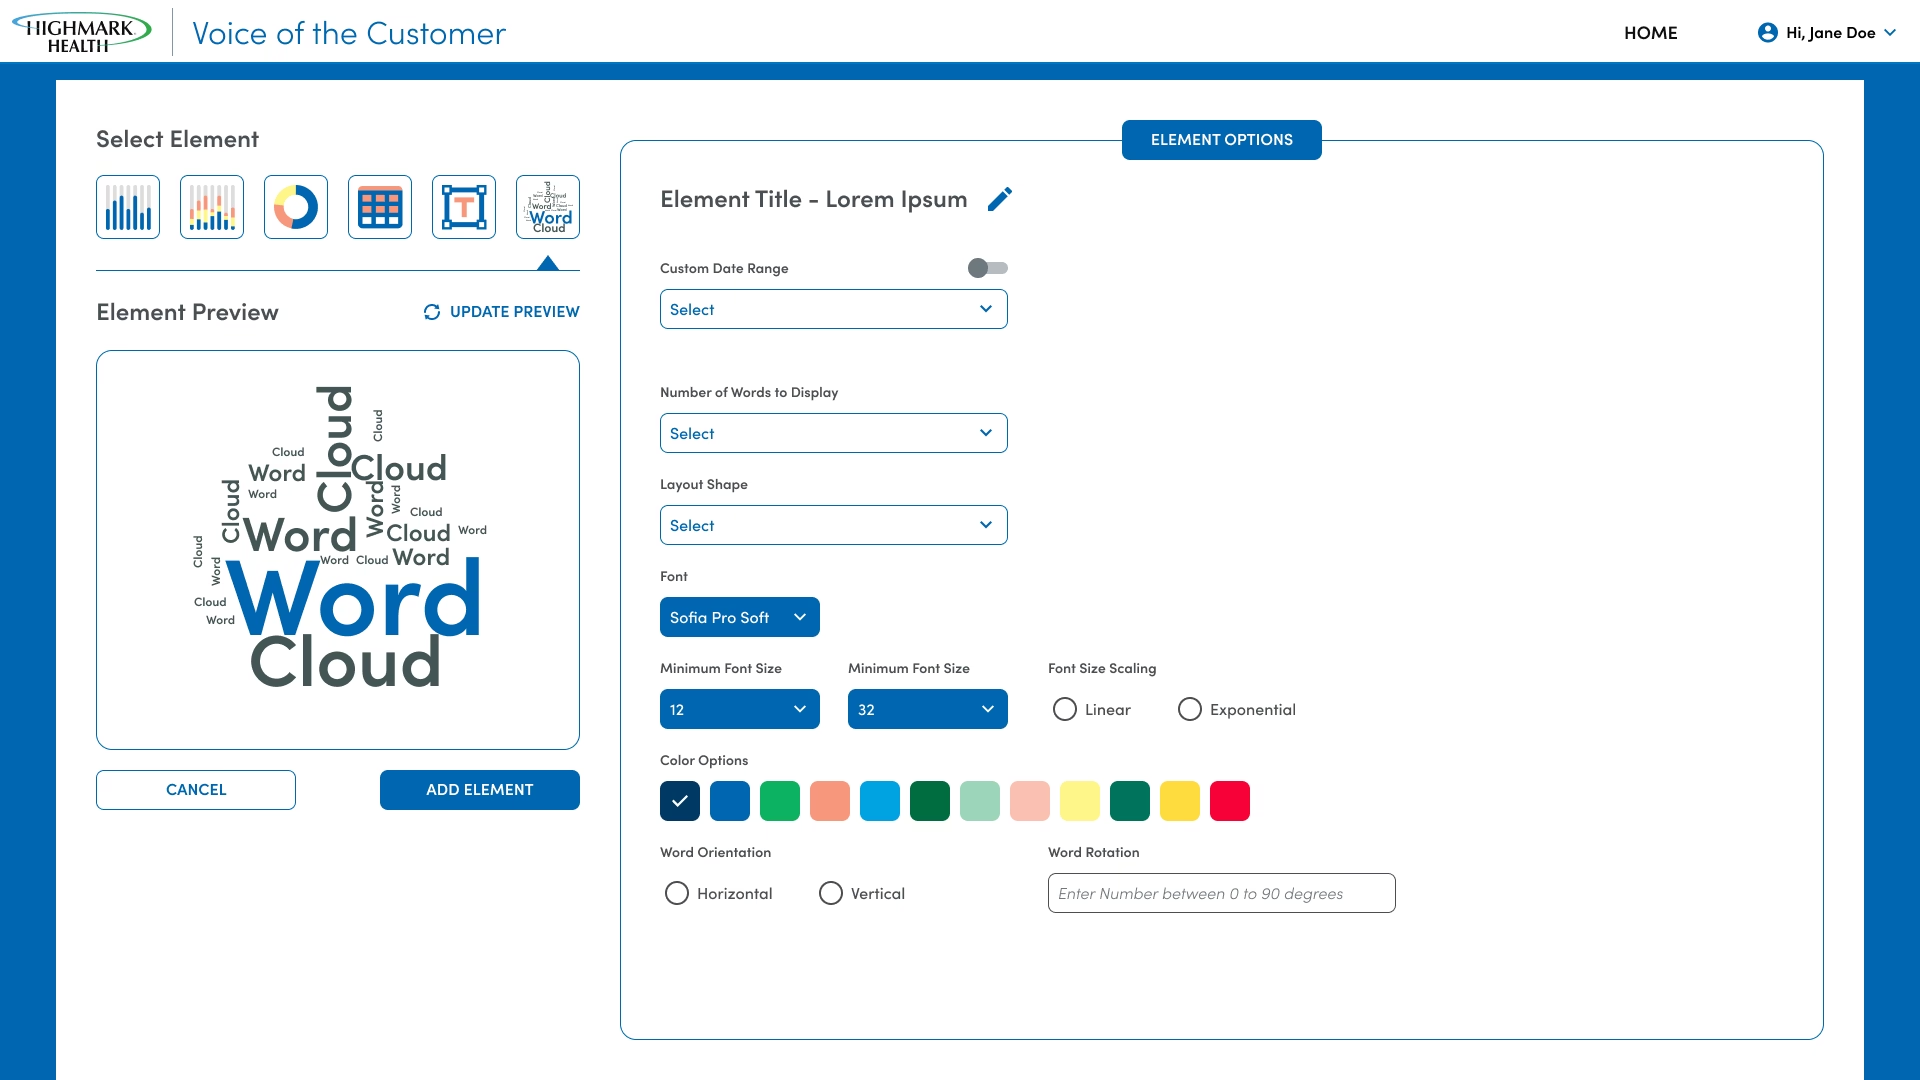
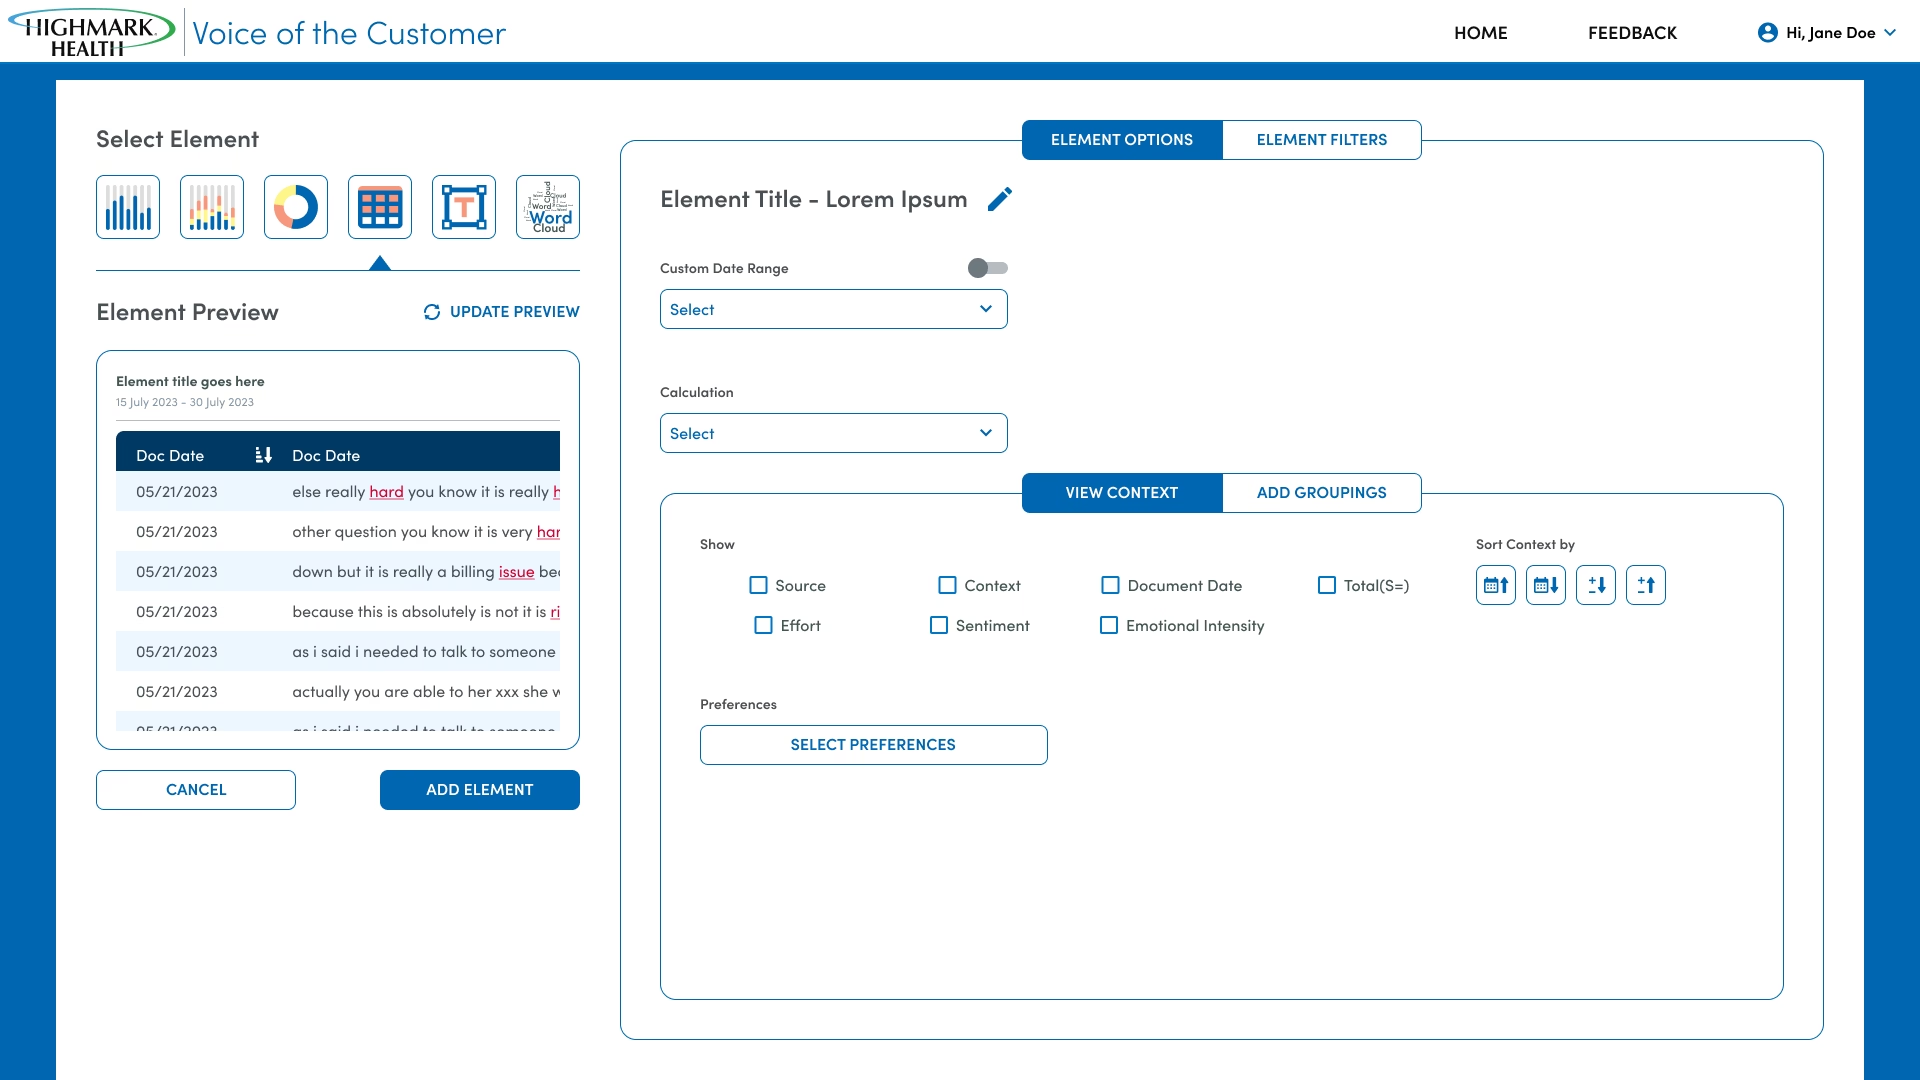
• Resizable layout to provided a flexible canvas where users could add various elements (charts, tables, text boxes) and easily resize and reposition them.
• Designed an intuitive property panel for each element, allowing detailed customization for Chart Types, Date Ranges, Data Grouping and Filtering
• "Set as Filter Element" Functionality enabled creators to design any chart as a filtering mechanism for other elements, vastly increasing dashboard interactivity and dynamic exploration. This allows CX analysts to design focused investigative tools for specific product teams.
• Real-time Preview allowed creators to instantly see the impact of their configuration changes, fostering rapid iteration and validation during dashboard construction.
Visualizing NLP Outputs
• Sentiment Highlight in the Document Explorer, green-highlighted words indicate positive sentiment, and red indicates negative, providing immediate contextual understanding of feedback.
• Emotion Bubbles/Tags were used to clearly display identified emotions (e.g., "Confusion," "Frustration") and their intensity levels (Low, Medium, High) alongside the feedback.
• Customer comments are tagged with relevant member journey phases and sub-categories, providing an instant link between feedback and a specific part of the customer's interaction lifecycle.
Technology Constraints
• Collaborated with backend engineers to understand data structures in both Cloud SQL (transactional) and BigQuery (analytical). This ensured design concepts were technically feasible and optimized for efficient data retrieval.
• Recognizing the massive data volumes, designs accounted for potential latency.
• Implemented caching strategies within the UI (via the Next.js frontend and Django backend) to minimize redundant queries and accelerate load times for frequently accessed dashboards.
• Optimized data display to send minimal, pre-formatted results from the backend, reducing API payload sizes.
• Leveraging Next.js enabled pre-rendering dashboard elements on the server, ensuring faster initial page loads and improved perceived performance, especially for dashboards with many elements.
Deliver with Confidence
The launch of EVOC marked a significant milestone for Highmark, transforming how customer feedback informs business strategy.
Cost Savings
• Successfully replaced an expensive vendor solution with an internal tool operating "at a fraction of the cost.
Enhanced Data Utilization
• Overcame data governance barriers by bringing sensitive, full-fidelity data (e.g., call transcripts) in-house. This yielded richer, unredacted insights into customer sentiment.
Empowered Decision-Making
• Enabled the CX team to holistically analyze member and patient data across channels, identifying critical pain points and prioritizing investment in solutions that truly matter.
• For example, identified "plan selection, scheduling care, and post-care support" as key pain points for a "Virtual Choice plan," guiding further research and targeted interventions.
• Allowed direct tracking of sentiment shifts due to business interventions (e.g., the Medicare Advantage billing issue in Delaware) by comparing quarter-over-quarter data.
Improved User Experience for Analysts
• Dashboard consumers quickly gain an overview and filter data.
• Dashboard creators rapidly build and customize complex analytical tools specific to various product teams or research needs.
Scalable Foundation
• The robust architecture and NLP models lay a strong foundation for future expansion, including additional data sources, more refined NLP capabilities (context awareness, intent detection), and broader internal user adoption.
Lessons Learned & Future Directions
Best Practices That Never Gets Skipped!!
Advanced Data Visualization helps in exploring new visualization types to represent complex correlations from expanding NLP models (e.g., the Customer Effort Model).
Designing features that proactively flag significant changes in sentiment or emerging pain points, pushing insights to users rather than relying solely on active exploration.
Developing tailored dashboard experiences for different roles within the organization, serving up the most relevant information without overwhelming users.
UX/UI considerations for combining qualitative feedback with quantitative behavioral data (e.g., website clicks, app usage) to provide a 360-degree view of the customer.
By continuously iterating on the design and integrating cutting-edge NLP, EVOC is not just a tool; it's a strategic asset that transforms how Highmark understands and responds to its customers, driving continuous improvement in the healthcare experience.